
Most founders track their KPIs as a list. Revenue, burn, churn, CAC, pipeline, headcount, each in its own row of the board deck, each with its own arrow. The list works fine until a number misses. Then it goes quiet. It can tell you ARR came in below plan. It cannot tell you why, because nothing on the list says how the rows relate to each other.
A metric tree fixes that. It is not a new idea, either: DuPont was running its business on one in 1914.
What a metric tree is
A metric tree takes one outcome and breaks it into the metrics that produce it. The outcome sits at the top, at the root. Beneath it are the numbers that add up to it, and beneath those, the operating levers that move them. Read it top down and it explains a result. Read it bottom up and it shows what a change in the business will do to the number your board cares about.
The difference from a list is structure. A list has 20 metrics of equal weight. A tree has one number that matters most and a clear path from it to everything else.
A worked example: SaaS
Take a subscription software company. The growth root is ARR.
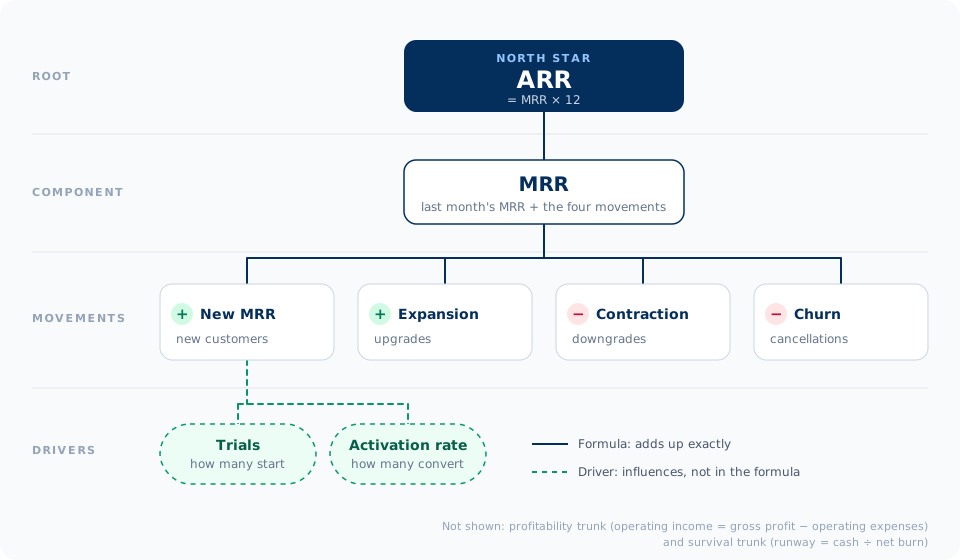
ARR is MRR times 12, so the first branch is simple. MRR is where the story starts: this month's MRR is last month's, plus new and expansion MRR, minus contraction and churned MRR. Those four movements explain every change in recurring revenue. Beneath new MRR sit the drivers: how many trials start, and the share of them that activate and start paying.
The scenario
Here is a hypothetical company planning its month. It starts at $92,000 of MRR and plans to finish at $100,000, which is $1.2 million of ARR. To get there, it expects 100 new trials converting at 40% into customers paying about $250 a month, which is $10,000 of new MRR. It plans $3,000 of expansion, $1,000 of contraction, and $4,000 of churn.
The month closes at $96,000. ARR is $48,000 short of plan, and a KPI list would stop right there.
Filling in the tree
Here is the same tree with the month's actual results, and the plan shown wherever a number missed.
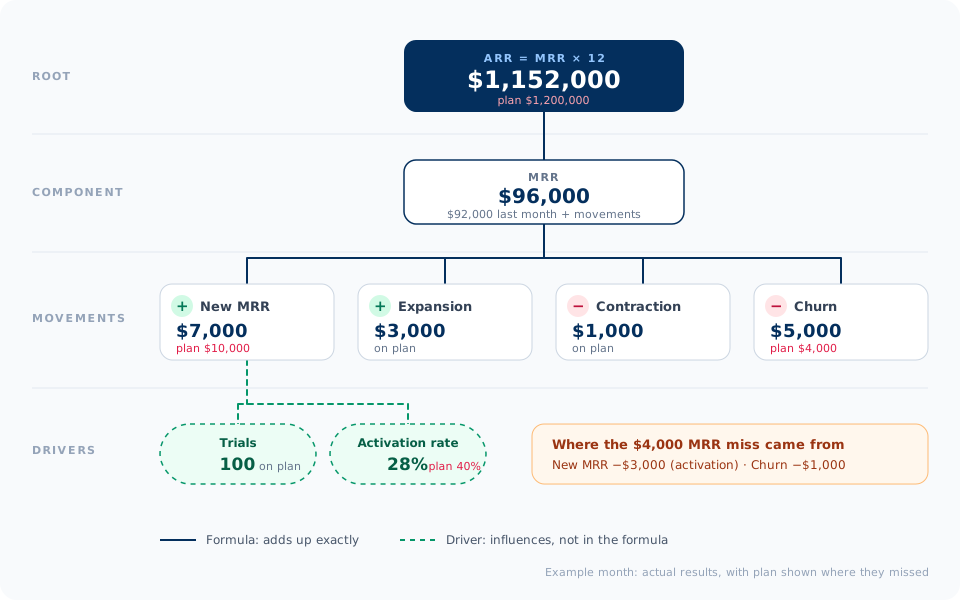
Read it from the top down.
The movements. The $4,000 MRR gap sits in two places. New MRR came in $3,000 short and churn ran $1,000 high. Expansion and contraction held, so you can ignore them.
The drivers under new MRR. Trials were on plan: 100 started, as forecast. Activation was not. The plan assumed 40% of trials would convert; 28% did. At about $250 a month per new customer, 12 fewer conversions is roughly $3,000 of new MRR, about the whole gap.
Note the word roughly. That last step is a driver estimate, not a formula: deal sizes could have shifted too, and the tree marks that link as a driver for exactly that reason.
The levers to pull
The tree does not just explain the miss. It ranks the fixes.
- Activation is the big lever. At this company's numbers, each point of activation is worth about $250 of MRR, or $3,000 of ARR, every month. Getting back from 28% to 40% recovers the whole $3,000. Activation fell the month a new onboarding flow shipped, so the first moves are to roll back the step that changed and to call the trials that stalled before they expire.
- Do not buy more pipeline yet. Trials were on plan. Spending more to fill the top of the funnel would pour more trials into a conversion step that is leaking. Fix activation first; then more trials are worth paying for.
- Churn is the second lever. $1,000 over plan is small, but it repeats every month it goes unfixed. Look at which accounts left and whether they share a cause, such as a missing feature or a rough first month, then add a check-in for at-risk accounts before renewal.
- Leave expansion and contraction alone. They held. Pulling on them now would be work without a problem to solve.
The board conversation moves from "we missed ARR" to "activation fell after an onboarding change; we are reversing it, calling the stalled trials, and holding marketing spend flat until conversion recovers." That is a plan a board can hold you to.
Three trunks: growth, profitability, and survival
A complete tree has three trunks, each answering a different question.
- Growth: what are you building? It ends in the north star, the number that measures progress: ARR in the example above.
- Profitability: does the business earn money? It ends in operating income, which is gross profit minus operating expenses, the line EBITDA is built from.
- Survival: how long can you keep building? It ends in runway, which is cash divided by net burn, and net burn is what you spend minus what you bring in.
Most startup metric trees stop at two trunks, growth and survival. ClariFi added the profitability trunk to its trees so the same structure works for established companies as well as startups. For a company burning cash, profitability and survival tell a similar story. Once a business is profitable, runway stops being the constraint and operating income becomes the trunk that shows whether growth is paying for itself.
Run the same company through the other two trunks. It has $1.8 million in the bank and spends $210,000 a month. On plan, $100,000 of revenue meant an operating loss and net burn of $110,000, and 16.4 months of runway. At $96,000, the loss and net burn are $114,000 and runway is 15.8 months. One month's $4,000 miss cost about two and a half weeks of runway, and if activation stays down, the gap compounds every month.
You need all three because they pull against each other. Spending ahead of plan on sales can lift ARR while it deepens the loss and shortens runway. Cutting spend does the reverse. A tree with one trunk hides those trade-offs. A tree with all three puts them on one page.
Three kinds of connection
Not every line in a tree means the same thing, and the difference matters.
- Components add up or multiply out exactly. ARR is MRR times 12. Net burn is expenses minus revenue. If you know the parts, you know the whole.
- Movements are the flows that roll a balance from one period to the next: new, expansion, contraction, and churned MRR. They also reconcile exactly.
- Drivers influence a metric without being in its formula. Pipeline drives new MRR, but no equation turns one into the other; the conversion rate in between moves on its own.
Confusing drivers with formulas is where board promises go wrong. "We doubled pipeline, so new MRR doubles next quarter" sounds like arithmetic. It is a forecast that assumes win rates and deal sizes hold, and they rarely do while you are scaling a sales team. Draw drivers as drivers and the assumption becomes visible before it becomes a miss.
A short history
The idea is older than software. In 1914, Donaldson Brown, then at DuPont, broke return on investment into its parts: how much each sale earns, and how hard the capital behind it works. From 1919, DuPont's executives reviewed those numbers on large charts in a room built for the purpose, and Brown carried the method to General Motors in 1921. Finance students still learn it as DuPont analysis. Those were components: exact math.
Management consultants built the same structure for problems. McKinsey's issue trees split a question into branches that are mutually exclusive and collectively exhaustive, the MECE rule popularized by Barbara Minto's Pyramid Principle, and its ROIC driver trees apply that discipline to a number, much as DuPont did.
In 1992, Robert Kaplan and David Norton's balanced scorecard argued that financial results only look backward. By 2000 they were drawing strategy maps that tied customer and operating measures to the financials through cause and effect. Those were drivers.
Product and data teams finished the picture. Amplitude's North Star Playbook (2019) put one customer-value metric at the top, and more recently Abhi Sivasailam of Levers Labs formalized the metric tree for the modern data stack: decompose the north star into components, then map the influences.
The idea hasn't changed. The cost has: a tree used to need a chart room, and now it can update every time the books close.
The root depends on your business model
The profitability and survival trunks look the same for almost every company. The growth root does not.
- SaaS roots growth in ARR, because recurring revenue compounds and retention shows up in it directly.
- E-commerce roots it in gross profit, net revenue minus cost of goods, because revenue without margin does not pay for the next order.
- Marketplaces root it in net revenue, the slice of transaction value you keep, with drivers like active sellers, match rate, and take rate beneath it.
- AI software keeps the SaaS root, ARR, but its tree reaches deeper into cost: inference cost sits inside COGS, with drivers like GPU utilization and the share of requests routed to smaller models.
- Pre-revenue biotech has no profitability trunk yet, and roots growth and survival both in runway. Until there is revenue, the number that measures progress and the number that measures survival are the same: months of cash to reach the next milestone.
Choosing the wrong root is a quiet mistake. An e-commerce company that roots its tree in revenue will celebrate growth that loses money on every order.
How to use one
The monthly review is where a tree earns its place. Start at the root and compare it with plan. If it is on plan, you are done with that trunk. If it moved, walk down the branch that moved, one level at a time, until you reach a driver someone can act on. Ignore the branches that held. In the example above, that walk took three steps: ARR, then the four movements, then activation, and the levers followed from where it stopped.
That changes the meeting. Instead of a tour of 20 KPIs, you get one explanation: what moved, why, and what we are doing about it. The board hears a reason, not a list.
See the tree for your industry
We have mapped every core startup metric into trees by industry, with definitions, formulas, and stage benchmarks for each node. Start with SaaS, AI software, e-commerce, marketplaces, or biotech, or browse the full Metric Tree for all 15 industries.
References
- Hagley Museum and Library, "The Father of ROI: Donaldson Brown."
- Hagley Museum and Library, "The DuPont Company's Chart Room."
- Umbrex, "MECE Principle," on its popularization through Barbara Minto's work and consulting training.
- Barbara Minto, "The Minto Pyramid Principle."
- McKinsey & Company, "Selecting P&L-linked KPIs for industrial transformations," on ROIC driver trees.
- Robert S. Kaplan and David P. Norton, "The Balanced Scorecard: Measures That Drive Performance," Harvard Business Review, January 1992.
- Amplitude, "Introducing the North Star Playbook," 2019.
- Count, "Intro to Metric Trees," summarizing the Levers Labs method by Trevor Fox and Abhi Sivasailam.
